 maogeigei
cad356047c
maogeigei
cad356047c
- 引入 lieflat-charts 第三方图表技能到 subskills/(SKILL.md+catalog+templates,已删嵌套 .git)
- ECharts 6.1.0 本地化至 mcn-work-shop/public/vendor/(零 CDN 依赖,离线可用)
- 账号详情视频列表 tab 上方新增趋势图:X=发布时间升序,点赞/评论双序列面积折线
  (G8 Rainfall 骨架:双 grid 独立量级、同 X 联动 pointer、tipLight tooltip、quarticOut 入场)
- 全量视频数据单独拉取(pageSize=500,不随分页变化);numOf 解析 'x.x万' 文本
- V1.0/SKILL.md 登记 lieflat-charts 外部技能依赖
19 KiB
Lieflat Charts
中文 | English
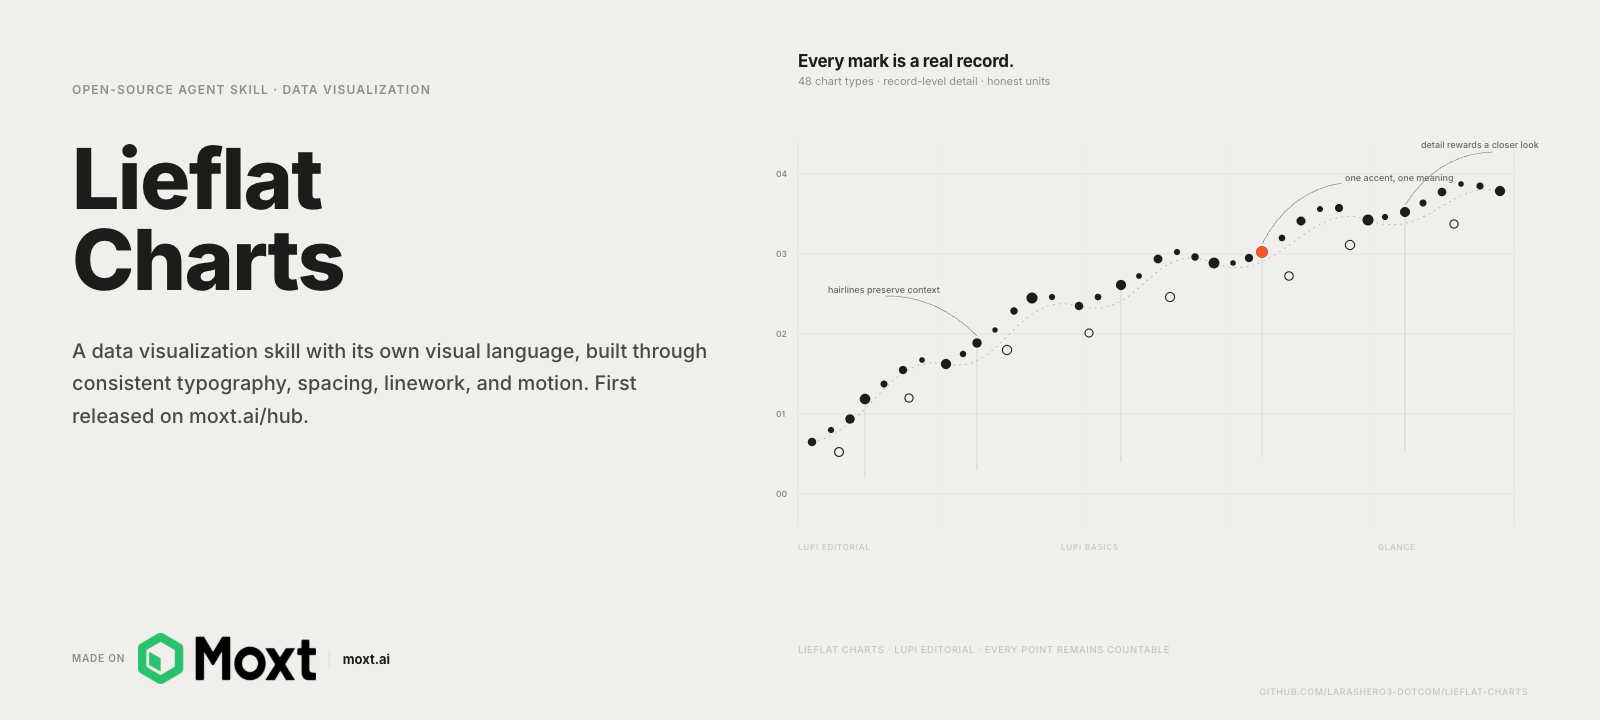
Lieflat Charts is an Agent Skills-compatible data visualization and report-generation skill for moxt, Claude Code, Codex, and other AI agents that support SKILL.md. Created at moxt.ai, it defaults to polished charts; it switches to one of 12 full-page templates, each available in Chinese and English, only when the user explicitly asks for a report, annual report, monthly report, white paper, poster, brief, or similar narrative deliverable.
Its visual language is built around consistent typography, spacing, line work, and motion. It includes three main chart families:
- Lupi Editorial: fine lines, dot fields, record-level detail, annotations, and generous whitespace for papers, long-form articles, annual reports, and slow-reading data stories.
- Glance: bold bars, large numbers, blocks, and clear ranking for reports, dashboards, and situations where readers need the answer in seconds.
- Lupi Basics: familiar bar, line, area, donut, and scatter silhouettes rebuilt with countable units, hairlines, and editorial typography.
The skill also includes standalone interactive visualizations for networks, paths, and dense multi-segment flows. Each chart aims to preserve honest data units while treating headlines, annotations, sources, and page structure as part of the visualization.
Mono is the reliable fallback, but color does not require an explicit user request. The agent can choose automatically between Mono, Porcelain, Palm, and Wire based on the data structure and publishing context; when the fit is unclear, it returns to Mono. When users provide brand colors or exact values, the skill can build one custom palette. One HTML file or chart set uses one color system only while preserving structure, contrast, and data meaning.
Preview
Representative templates from each chart family.
Lupi Editorial
Detailed, record-level, and editorial. Selected examples from 20 narrative templates.
 |
 |
 | |
Glance
Fast reading, pre-aggregated information, and conclusion-first composition. Selected examples from 22 Glance templates.
 |
 |
 | |
Motion preview:

More motion examples:
 Fifty markets |
 Eight products race |
 H1 revenue |
Lupi Basics
Familiar chart forms built from countable visual units. Selected examples from 17 foundational templates.
 |
 |
Interactive
For networks, paths, and high-density relationship data.
Motion preview:

Open the Force Graph template to try dragging and zooming
Added Color Mode
The skill can automatically choose Mono or one color preset from the data structure and publishing context; users do not need to request color first. Porcelain suits ordered or single-series data, Palm suits a small number of unordered categories, and Wire suits a restrained composition with one focal point. When the fit is unclear, the skill returns to Mono. Users who provide brand colors or exact values can use one custom palette. Each HTML file or chart set still locks one color system, with contrast, hierarchy, and data meaning checked after every change.
Porcelain
A single-hue blue scale for ordered data and single-series charts.


 Basics |
 Glance |
 Lupi Editorial | |
Palm
A low-saturation green and yellow family for a small number of unordered categories.


 Basics |
 Glance |
 Lupi Editorial | |
Wire
A black and gray palette with one fluorescent orange focal point.


 Basics |
 Glance |
 Lupi Editorial | |
Latest Update
Added Report Mode
Lieflat Charts can now generate complete HTML reports in addition to individual charts. The 12 full-page templates are available in Chinese and English for research reports, research briefs, business data reports, financial and economic analysis, product records, dashboards, posters, and personal datasets such as sports, travel, and yearly life logs. Template names describe the layout's character, not a hard use-case restriction; the same layout can move across report types when the information structure fits.
 R03 · Annual Data Report / Poster |
 R09 · Business Data / Financial Dashboard |
 R12 · Periodic Data Brief / Monitoring Summary |
 R08 · Population / Socioeconomic One-Pager |
 R01 · Research Report / One-Pager |
 R05 · Project / Product Impact Story |
 R10 · Personal Data / Sports / Travel Record |
 R07 · Research / Market Data Collage Poster |
 R02 · Annual Review / Performance Recap |
 R11 · Research / Financial Brief Card |
 R04 · Monthly Business / Financial Report |
 R06 · Long-Cycle Product / Business Almanac |
Quick Start
Recommended: Use It in Moxt

Lieflat Charts was designed, tested, and continuously refined in Moxt. Its design rules, template structure, and file workflow were shaped through repeated use with Moxt's Agent collaboration model.
In Moxt, an Agent can more smoothly read the complete design specification, understand the visual language, apply the appropriate templates, and keep previewing and refining the result in the same workspace. This makes the Lieflat Charts design more consistent in practice.
| Lieflat Charts workflow | A typical one-shot chat | In Moxt |
|---|---|---|
| Understanding the design language | The Agent rebuilds its understanding from the Skill files | The Skill was designed and validated in the same Agent environment |
| Reading rules, templates, and data | Files or paths may need to be supplied repeatedly | Rules, templates, data, and output remain together in one workspace |
| Iterating on charts | Context may need to be explained again in a new conversation | The Agent can continue from the files and context already in the workspace |
| Producing the final result | Output may remain in a chat or temporary directory | The HTML result stays beside its data and templates for further refinement |
Lieflat Charts still works with other tools that support Agent Skills. Moxt is its native production environment and the recommended path for the most complete workflow with the fewest setup steps.
Install in Other Agents
Install with one command:
npx skills add https://github.com/larashero3-dotcom/lieflat-charts --skill lieflat-charts
You can also send the following instruction to an AI agent with shell access:
Install lieflat-charts. Clone https://github.com/larashero3-dotcom/lieflat-charts
to ~/.claude/skills/lieflat-charts, then verify that SKILL.md, templates/,
catalog.md, and mono-tokens.js are present.
For Codex, replace the installation path with ~/.codex/skills/lieflat-charts.
To update an existing installation:
Update lieflat-charts. Enter ~/.claude/skills/lieflat-charts, run git pull,
and report the latest commit.
After installation, ask your agent:
Turn this research dataset into five charts for a long-form article.
Compare Lupi Editorial and Lupi Basics first. Use Glance only if neither group fits.
More prompt examples:
Use lieflat-charts to turn this dataset into a color chart.
Read this paper, identify the strongest data findings, and build a complete HTML chart page.
This is weekly reporting data. Make the ranking, changes, and anomalies readable within ten seconds.
Turn this CSV into a Glance chart suitable for a presentation.
Redesign this dataset in the Lupi style, preserving every real record and adding useful annotations.
Rebuild this chart with the Porcelain preset. Use lightness to represent value without changing the structure.
The number of charts follows the number of independent findings: one chart for one question, two or three charts for two or three findings, and four to six charts for a complete article or paper. A single page defaults to no more than six charts, and repeated conclusions are removed rather than added to meet a quota.
Templates
| Family | Count | Best for | Implementation |
|---|---|---|---|
| Lupi Editorial | 15 | Annual reports, papers, long-form articles, posters, portfolios, and readers willing to inspect detail | Handwritten SVG |
| Lupi Basics | 13 | Bars, lines, areas, donuts, scatterplots, waterfalls, heatmaps, progress, treemaps, and other foundational data shapes | Handwritten SVG / ECharts |
| Glance | 18 | Weekly reports, dashboards, monitoring, and presentations that require fast comparison | Chart.js / ECharts |
| Interactive | 3 | Networks, paths, multi-segment flows, and high-density relationship data | ECharts / SVG |
| Color Presets | 3 families / 15 samples | Distinguishing real data dimensions or adding one controlled focal point to monochrome charts | Restyled original templates |
| Report Templates | 12 templates / two languages | Research, annual, monthly, dashboard, poster, brief, and notebook-style full-page reports | Single-file HTML |
Lupi Editorial
Each point, line, and annotation should map to a real unit whenever possible. Lupi Editorial does not rush to aggregate the evidence into a single number. It lays out records, distributions, structures, and exceptions through hairlines, whitespace, ledger-like guides, annotations, and low-contrast value scales.
Lupi Basics
Lupi Basics retains familiar chart silhouettes while rebuilding them inside the same editorial language. A cell can represent one percentage point, a tick can represent one person, a hairline can represent one day, and a treemap rectangle can represent one honest weight. It is suited to smaller datasets that still need density and countable visual units.
Glance
Glance pre-aggregates information, strengthens the main forms, and places the key ranking or change in the first visual pass. It is not a simplified Lupi mode. It serves a different reading speed: readers can identify what is higher, what changed most, and what needs attention within seconds.
Interactive
Interactive templates handle relationship data that ordinary static charts cannot carry. Hover, focus, dragging, pinned paths, and status readouts turn complex networks into records that can be queried one by one. Interaction is reserved for real data, not decorative elements.
Design
Every family shares the same core visual language: paper gray and charcoal at the extremes, a controlled grayscale ladder between them, and data encoded through lightness, position, length, density, and structure. The three color presets provide stable starting points. Explicit brand colors can also become one role-based custom palette. When users refine the palette, contrast, hierarchy, and data meaning still need to remain clear.
Lieflat Charts differs from a conventional chart generator in more than color:
- It identifies the data contract before choosing a chart.
- Each chart carries one independent conclusion before charts are assembled into a page.
- Real data units become visual atoms instead of using decorative noise to imitate density.
- Headlines, annotations, sources, spacing, and motion are treated as part of the chart.
- Lupi and Glance represent different reading speeds, not simply static versus interactive output.
Structure
.
├── README.md                # Chinese project guide
├── README.en.md             # English project guide
├── SKILL.md                 # Agent workflow and design rules
├── catalog.md               # Data-contract index for 49 chart types
├── report-catalog.md        # Scenario index for 12 report templates
├── mono-tokens.js           # Shared monochrome design tokens
├── color-presets.js         # Three built-in color presets
├── templates/               # Lupi, Basics, Glance, interactive, and report templates
│   ├── color/               # Color-restyled samples
│   └── reports/             # 12 report templates, each in Chinese and English
├── examples/                # Examples based on public datasets
├── docs/assets/             # README screenshots and motion previews
└── scripts/validate.mjs     # Pre-release validation
Open the HTML files under templates/ directly to inspect the galleries. Open templates/reports/index.html to browse the report templates and their Chinese/English variants. Report mode chooses a full-page skeleton from report-catalog.md, then reuses the real chart implementations indexed in catalog.md for each chart slot. Lupi and Basics mainly use native SVG, while F13 Treemap uses ECharts. Glance, Circular, Force, and report templates R11/R12 also load Chart.js or ECharts from a CDN and require an internet connection unless those dependencies are inlined.
License
This project is licensed under the PolyForm Noncommercial License 1.0.0. Learning, modification, sharing, and noncommercial use are allowed. Commercial use requires separate permission.
Chart.js, Apache ECharts, and the Inter typeface remain subject to their original licenses. See THIRD_PARTY_NOTICES.md.